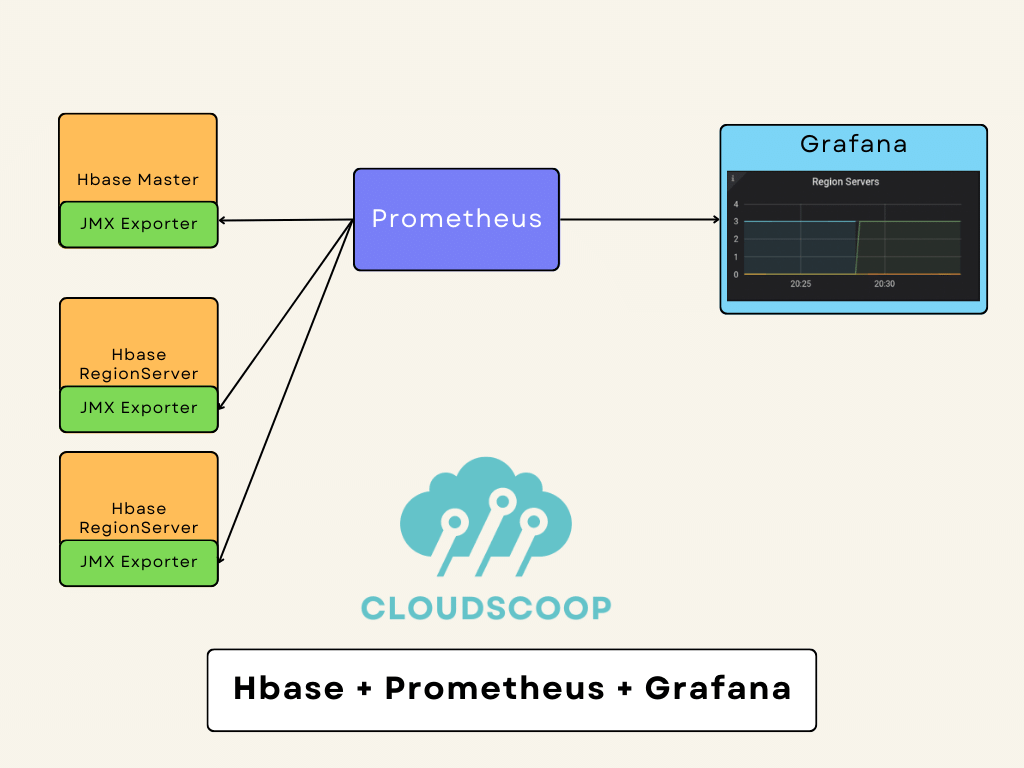
HBase is a distributed NoSQL database designed to store and manage large amounts of data across many commodity servers. It is critical to monitor HBase to ensure it is performing well and to identify issues before they become serious problems. Grafana is an open-source tool that allows you to visualize and analyze data from various sources. It is an ideal tool for monitoring HBase, as it provides a range of powerful visualization options that can help you identify trends and anomalies in your HBase performance data.
To monitor HBase with Grafana, you can use the following steps:
- Set up demo machines on Digital ocean.
- Set up Hbase with Hadoop using docker on 3 containers on one machine.
- Get data into Hbase.
- Configure JMX monitoring for HBase Master
- Update hbase-env.sh with the following line of code.
- Restart HBase Master
- Configure JMX monitoring for Hbase Slave i.e. regionserver
- Restart the HBase region server
- Install and Connect HBase with Prometheus
- Connect with Grafana.
- Design a beautiful dashboard.

Tools used:
- Virtual machines on Digital Ocean ( Get 200$Credit using the following link )
- Docker
- HBase
- HDFS
- Prometheus
- Grafana
- Set up the machine on Digital ocean.
- Set up the Machine with the following configurations.
- One machine for Installing Docker

- One machine for Installing Prometheus and Grafana.

2. Set up the Hbase with Hadoop using docker on 3 containers on one machine.
Install Docker and Docker-compose on Ubuntu Machine

sudo apt update
sudo apt install apt-transport-https ca-certificates curl software-properties-common
curl -fsSL https://download.docker.com/linux/ubuntu/gpg | sudo apt-key add -
sudo add-apt-repository "deb [arch=amd64] https://download.docker.com/linux/ubuntu bionic stable"

apt-cache policy docker-ce
sudo apt install docker-ce
sudo apt install docker-compose
sudo systemctl status docker
Get Code for Hbase on Docker and spin up the Containers.
git clone https://github.com/Cloudscoop/Monitoring-for-HBase-using-Docker-Grafana.git
cd Monitoring-for-HBase-using-Docker-Grafana

docker-compose up -d
Verify the Containers are running.
docker ps -all
docker exec -it master bash
3. Get data into Hbase.
a.Check hdfs working or not.
hdfs dfs -ls /

b.Create file with following contents.

vi importsv
rowkey000000000,Test1,Test2,Test3,Test4,Test5,Test6,Test7,Test8,Test9,Test10

c.Copy File to HDFS location.
[root@master /]#hdfs dfs -copyFromLocal importsv /tmp/
[root@master /]# hdfs dfs -ls /tmp/
	drwxrwx---   - root supergroup          0 2023-02-17 01:59 /tmp/hadoop-yarn
	-rw-r--r--   3 root supergroup         77 2023-02-17 02:04 /tmp/importsv
	drwxrwxrwt   - root supergroup          0 2023-02-17 02:04 /tmp/logs

d.Run Hbase Shell:

 [root@master /]#hbase shell
    >create 'bktable', {NAME => 'cf'},   {SPLITS => ['rowkey033333333', 'rowkey066666666']}
    >list
    >exit

e.Load data to Hbase Table

[root@master /]#hbase org.apache.hadoop.hbase.mapreduce.ImportTsv -Dimporttsv.columns=HBASE_ROW_KEY,cf:c1,cf:c2,cf:c3,cf:c4,cf:c5,cf:c6,cf:c7,cf:c8,cf:c9,cf:c10 -Dimporttsv.skip.bad.lines=false '-Dimporttsv.separator=,' -Dimporttsv.bulk.output=hdfs://master:9000/tmp/bktableoutput bktable hdfs://master:9000/tmp/importsv

f.Finalize Hbase table load:
hbase org.apache.hadoop.hbase.tool.LoadIncrementalHFiles hdfs://master:9000/tmp/bktableoutput bktable

g.Verify data in hbase shell
#hbase shell
Version 2.0.0-alpha4, r5c4b985f89c99cc8b0f8515a4097c811a0848835, Tue Oct 31 16:00:33 PDT 2017
Took 0.0043 seconds
hbase(main):001:0> list
TABLE
bktable
1 row(s)
Took 0.6737 seconds
hbase(main):002:0> scan 'bktable'
ROW                                                  COLUMN+CELL
 rowkey000000000                                     column=cf:c1, timestamp=1676599484915, value=Test1
 rowkey000000000                                     column=cf:c10, timestamp=1676599484915, value=Test10
 rowkey000000000                                     column=cf:c2, timestamp=1676599484915, value=Test2
 rowkey000000000                                     column=cf:c3, timestamp=1676599484915, value=Test3
 rowkey000000000                                     column=cf:c4, timestamp=1676599484915, value=Test4
 rowkey000000000                                     column=cf:c5, timestamp=1676599484915, value=Test5
 rowkey000000000                                     column=cf:c6, timestamp=1676599484915, value=Test6
 rowkey000000000                                     column=cf:c7, timestamp=1676599484915, value=Test7
 rowkey000000000                                     column=cf:c8, timestamp=1676599484915, value=Test8
 rowkey000000000                                     column=cf:c9, timestamp=1676599484915, value=Test9
1 row(s)
Took 0.4315 seconds- Configure JMX monitoring for Hbase Master and Slave
Get jmx_prometheus_javaagent-0.17.2.jar file from maven repository
#mkdir test
#cd /root/test
#wget https://repo1.maven.org/maven2/io/prometheus/jmx/jmx_prometheus_javaagent/0.17.2/jmx_prometheus_javaagent-0.17.2.jar
Create Config.yaml with the following contents,
root@master test]# cat config.yaml
rules:
- pattern: Hadoop<service=HBase, name=RegionServer, sub=Regions><>Namespace_([^\W_]+)_table_([^\W_]+)_region_([^\W_]+)_metric_(\w+)
  name: HBase_metric_$4
  labels:
    namespace: "$1"
    table: "$2"
    region: "$3"
- pattern: Hadoop<service=(\w+), name=(\w+), sub=(\w+)><>([\w._]+)
  name: hadoop_$1_$4
  labels:
    "name": "$2"
    "sub": "$3"
- pattern: .+


[root@master test]# ll
total 532
-rw-r--r-- 1 root root    371 Feb 17 03:28 config.yaml
-rw-r--r-- 1 root root 539536 Sep 21 21:40 jmx_prometheus_javaagent-0.17.2.jar
5.Update hbase-env.sh with the following line of code.
file: /opt/hbase/conf/hbase-env.sh

Add below line in Hbase Master,

export HBASE_OPTS="$HBASE_OPTS -javaagent:/test/jmx_prometheus_javaagent-0.17.2.jar=5555:/test/config.yaml"- Restart HBase Master
Stop or Kill the existing HBase Master process.Start HBase Master using following command.
bash /opt/hbase/bin/hbase-daemon.sh --config /opt/hbase/conf start masterCheck logs for any failure if any,
less /opt/hbase/logs/hbase--master-master.log
less /opt/hbase/logs/hbase--master-master.out
Verfiy:
curl localhost:5555- Configure JMX monitoring for Hbase Slave i.e. Regionserver
Login to RegionServer,
docker exec -it master bashGet Jar file and config.yaml as mentioned in STEP 4 from above.
Add following line in /opt/hbase/conf/hbase-env.sh
export HBASE_REGIONSERVER_OPTS="$HBASE_REGIONSERVER_OPTS -javaagent:/test/jmx_prometheus_javaagent-0.17.2.jar=5559:/test/config.yaml"- Restart HBase regionserver
Stop Regionserver and Start region server using the following command.
bash /opt/hbase/bin/hbase-daemon.sh --config /opt/hbase/conf start regionserverCheck logs for any failure if any,
less /opt/hbase/logs/hbase--master-master.log
less /opt/hbase/logs/hbase--master-master.out
Verify RegionServer metrics.
curl localhost:5559- Install Prometheus and Grafana.
Install Grafana on a server or cluster. Grafana can be installed on the same machine as the monitoring system or on a separate machine.
git clone https://github.com/Cloudscoop/Prometheus-Grafana.git

cd Prometheus-Grafana
sh Install_Prometheus.sh
sh Install_Grafana.sh
Configuration filename:
/etc/prometheus/prometheus.yml
Reload Prometheus without restarting Prometheus
Get Process ID for Prometheus
ps -elf | grep prometheus

4 S prometh+  1015     1  0  80   0 - 49609 futex_ 12:12 ?        00:00:01 /usr/local/bin/prometheus --config.file /etc/prometheus/prometheus.yml --storage.tsdb.path /var/lib/prometheus/ --web.console.templates=/etc/prometheus/consoles --web.console.libraries=/etc/prometheus/console_libraries
0 S root      1601  1457  0  80   0 -  3715 pipe_w 12:31 pts/0    00:00:00 grep --color=auto prometheus


root@ubuntu1:~/prometheus-course/scripts# kill -HUP 1015
9.Connect with Prometheus.
Update /etc/prometheus/prometheus.yml with following contents

- job_name: hbasemasters
  scrape_interval: 15s
  scrape_timeout: 10s
  metrics_path: /metrics
  scheme: http
  static_configs:
  - targets:
    - 170.64.188.180:5555
- job_name: hbaseregion1
  scrape_interval: 15s
  scrape_timeout: 10s
  metrics_path: /metrics
  scheme: http
  static_configs:
  - targets:
    - 170.64.188.180:5559
- job_name: hbaseregion2
  scrape_interval: 15s
  scrape_timeout: 10s
  metrics_path: /metrics
  scheme: http
  static_configs:
  - targets:
    - 170.64.188.180:5561


Reload Prometheus without restarting Prometheus
Get Process ID for Prometheus
#ps -elf | grep prometheus

4 S prometh+  1015     1  0  80   0 - 49609 futex_ 12:12 ?        00:00:01 /usr/local/bin/prometheus --config.file /etc/prometheus/prometheus.yml --storage.tsdb.path /var/lib/prometheus/ --web.console.templates=/etc/prometheus/consoles --web.console.libraries=/etc/prometheus/console_libraries
0 S root      1601  1457  0  80   0 -  3715 pipe_w 12:31 pts/0    00:00:00 grep --color=auto prometheus


root@ubuntu1:~/prometheus-course/scripts# kill -HUP 1015
10. Connect with Grafana.
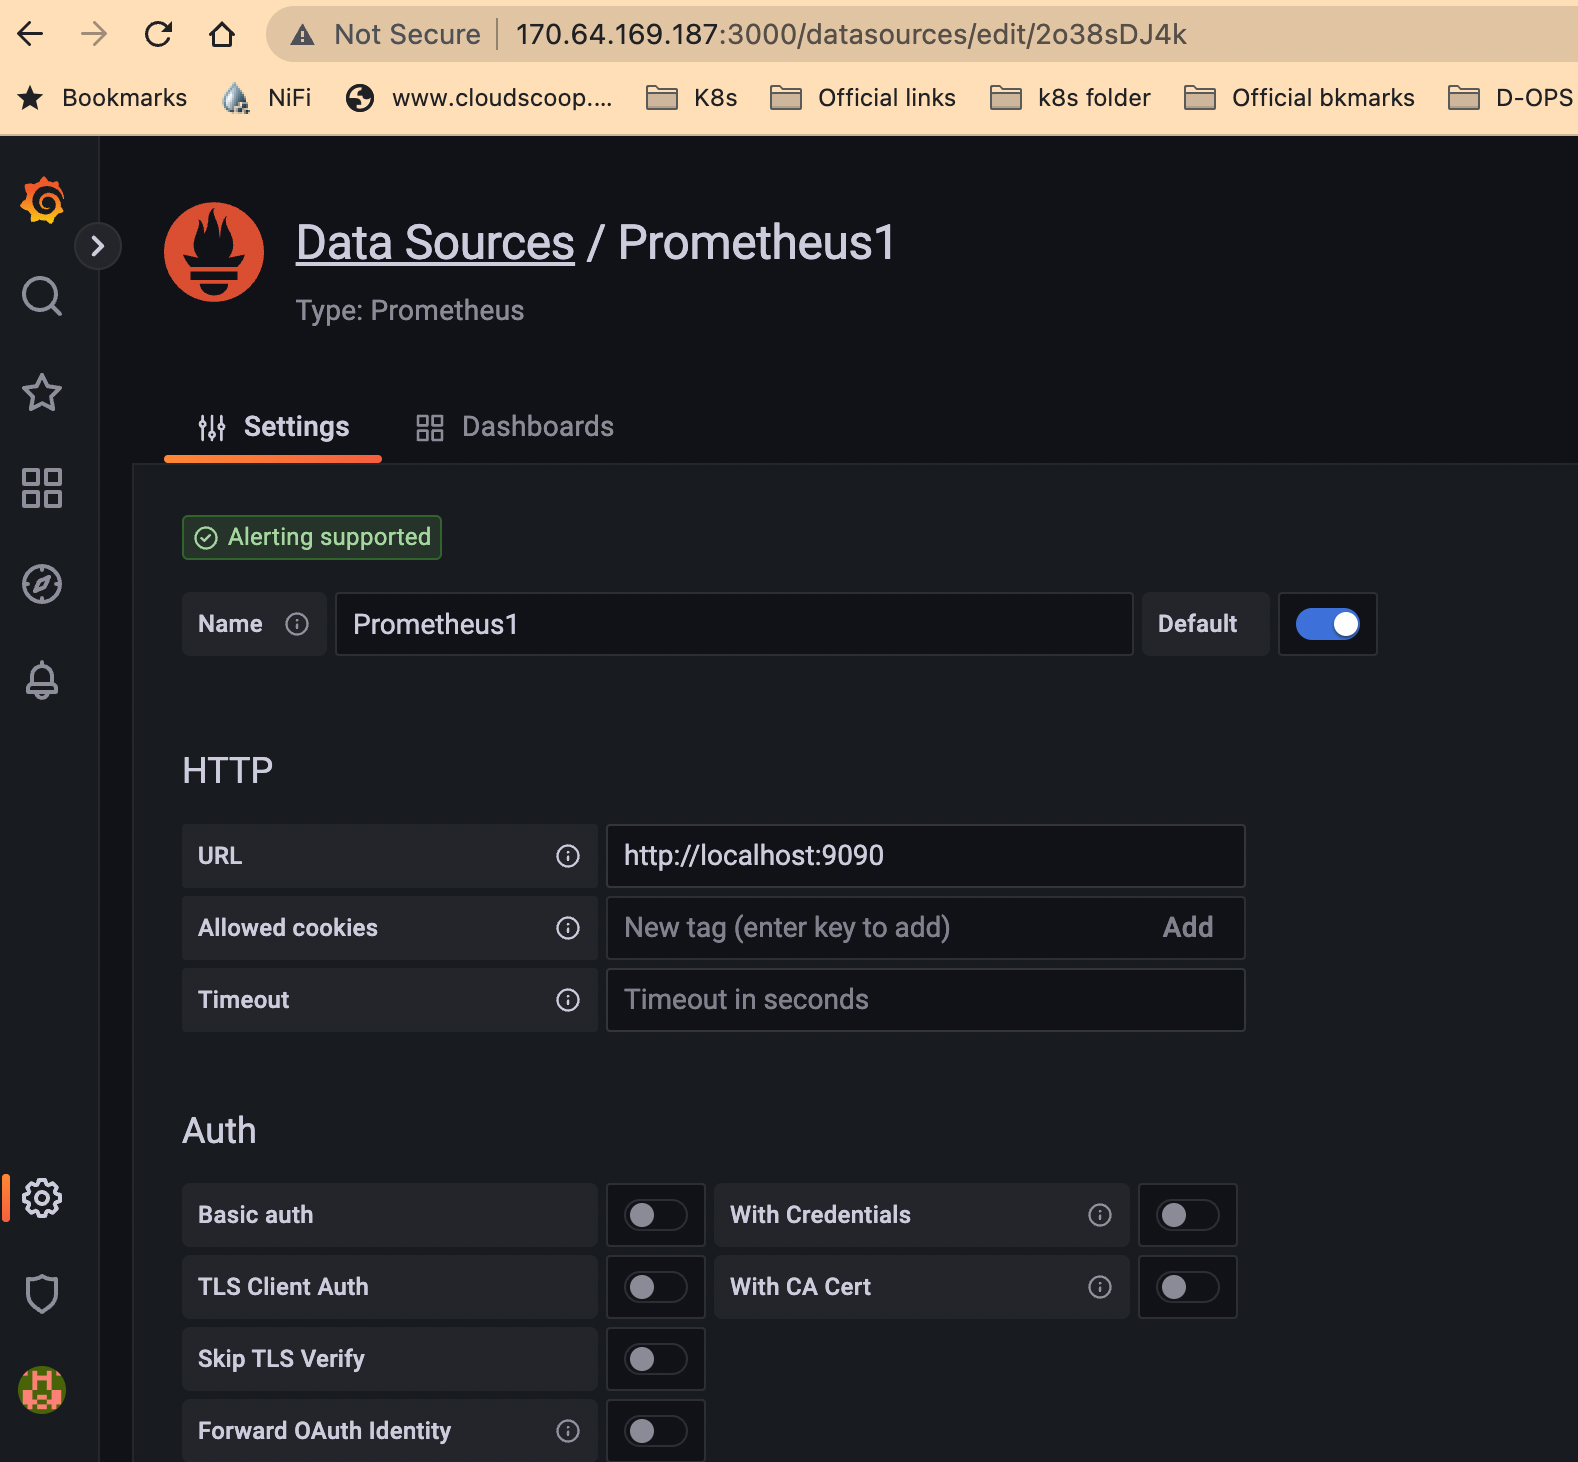
Configure Grafana to connect to your monitoring system. This involves setting up a data source in Grafana that points to your monitoring system.
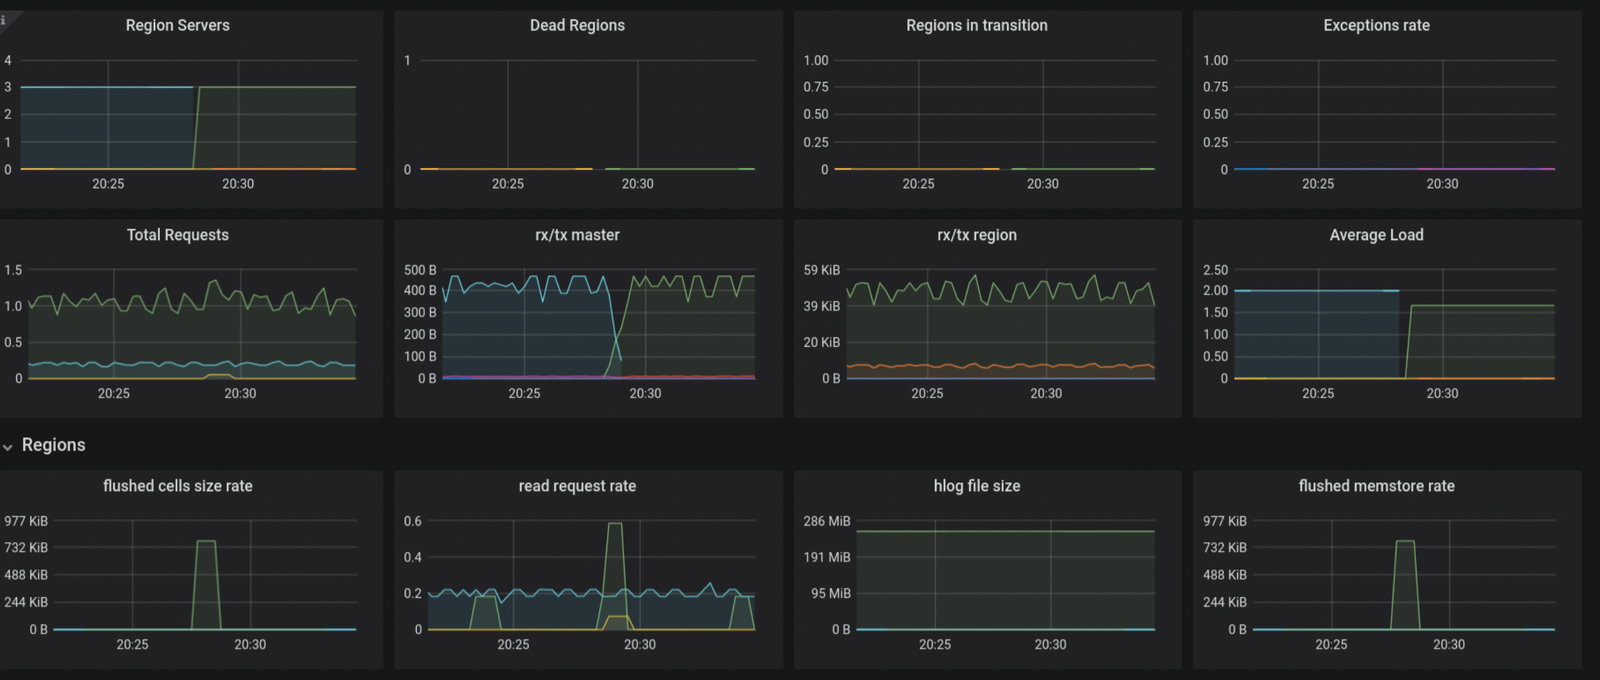
11. Design a beautiful dashboard.
Create a dashboard in Grafana that displays the HBase metrics you are interested in. Grafana provides a range of visualization options, including graphs, tables, and alerts.
Customize your dashboard to meet your specific monitoring requirements. For example, you can add annotations to your dashboard to highlight key events or metrics, such as peak usage periods or slow response times.
Use queries like hadoop_HBase_regionCount to design your graph